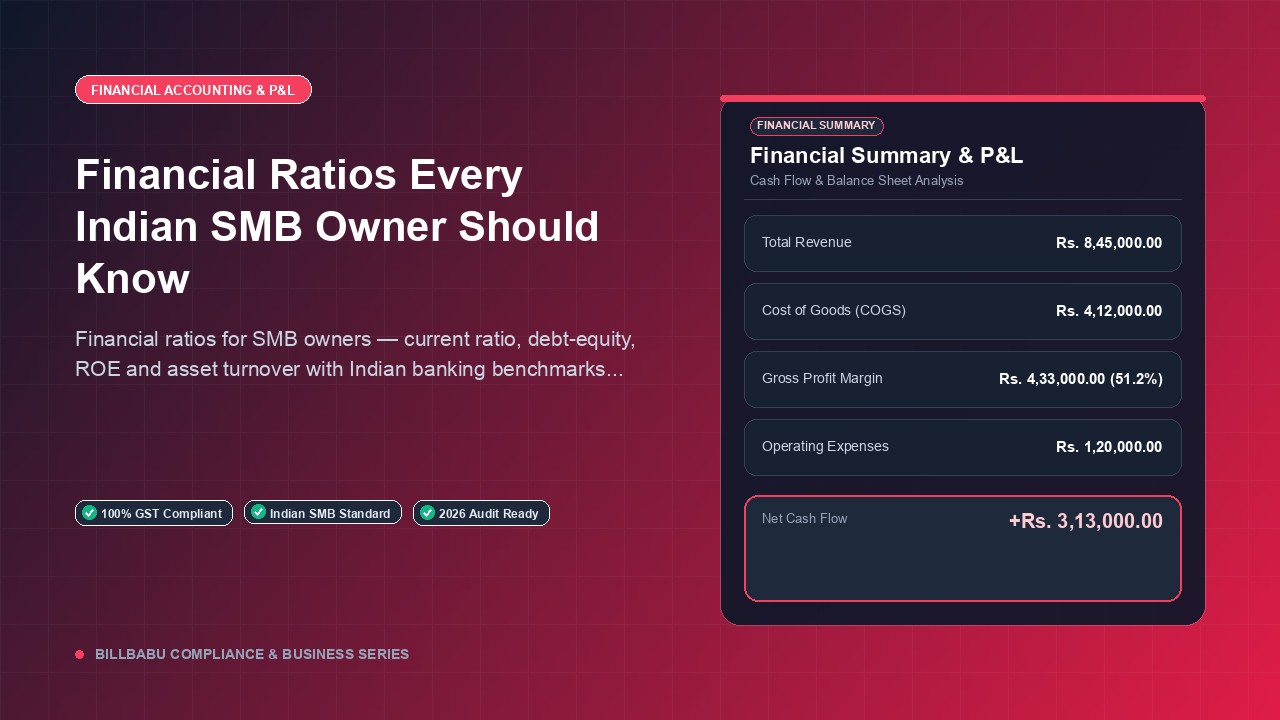
Financial Ratios Every Indian SMB Owner Should Know
Financial ratios for SMB owners — current ratio, debt-equity, ROE and asset turnover with Indian banking benchmarks explained simply.
BillBabu Team
BillBabu App Team
Financial ratios for SMB owners — current ratio, debt-equity, ROE and asset turnover with Indian banking benchmarks explained simply.
Why Ratios Matter More Than Absolute Numbers
A small business owner who tracks turnover and bank balance is flying blind — those numbers tell you "how much" but not "how well". Financial ratios convert your Balance Sheet and Profit & Loss into a handful of percentages and times-cover figures that banks, investors and tax officers actually use to judge your business. Indian banks pull these ratios automatically from your CMA data while sanctioning working capital limits. Tracking the same numbers internally every month means you never get surprised when a bank declines a loan or a customer asks for audited financials.
Liquidity Ratios — Can You Pay Your Bills
The Current Ratio = Current Assets / Current Liabilities tells you how many rupees of short-term assets you have for every rupee of short-term debt. A healthy SMB sits between 1.5 and 2 — below 1 is a red flag, above 3 means idle cash. The Quick Ratio excludes inventory (Current Assets minus Stock divided by Current Liabilities) and should stay above 1 for service businesses, 0.8 for trading. Indian bankers also look at the Working Capital Gap — the funding need beyond your own margin — which directly determines your cash credit limit.
Leverage Ratios — How Risky Are You
Debt-to-Equity = Total Debt / Shareholders' Funds (capital + reserves) shows how much you have borrowed against every rupee of owner money. RBI guidance prefers Indian SMBs to stay under 2:1 — manufacturing can stretch to 3:1, services should stay under 1.5:1. Interest Coverage Ratio = EBITDA / Interest tells lenders how comfortably you can service interest — below 1.5 means stress, above 3 is healthy. Section 43B of the Income Tax Act ties interest deductibility to actual payment, so high leverage with delayed interest payments hurts both the ratio and the tax outgo.
Profitability and Efficiency Ratios
Gross Margin = (Sales - COGS) / Sales shows your core trading strength — track it monthly because it moves with input prices. Net Margin = PAT / Sales tells the bottom-line story after all overheads and tax. Return on Equity (ROE) = PAT / Equity should beat fixed deposit returns (currently around 7%) by a clear margin — otherwise capital is better off in the bank. Asset Turnover = Sales / Total Assets shows how hard your assets are working — trading businesses target 3–4x, manufacturing 1.5–2x, service businesses can exceed 5x.
Dashboard Your Ratios Monthly with BillBabu
BillBabu computes the standard ratio set automatically from your live P&L and Balance Sheet — Current Ratio, Quick Ratio, Debt-Equity, Interest Coverage, Gross Margin, Net Margin, ROE and Asset Turnover. You see trends over the last 12 months on a single dashboard and can spot a deteriorating Current Ratio months before your banker does. When loan renewal time comes, you simply export the CMA-style summary and your banker receives ratios that already match audited figures.
Built for Indian small businesses. BillBabu is GST-compliant billing software that helps you create invoices, manage estimates, track payments and stay audit-ready — from your phone. Learn more about BillBabu or download the app.
Tags
Related Articles
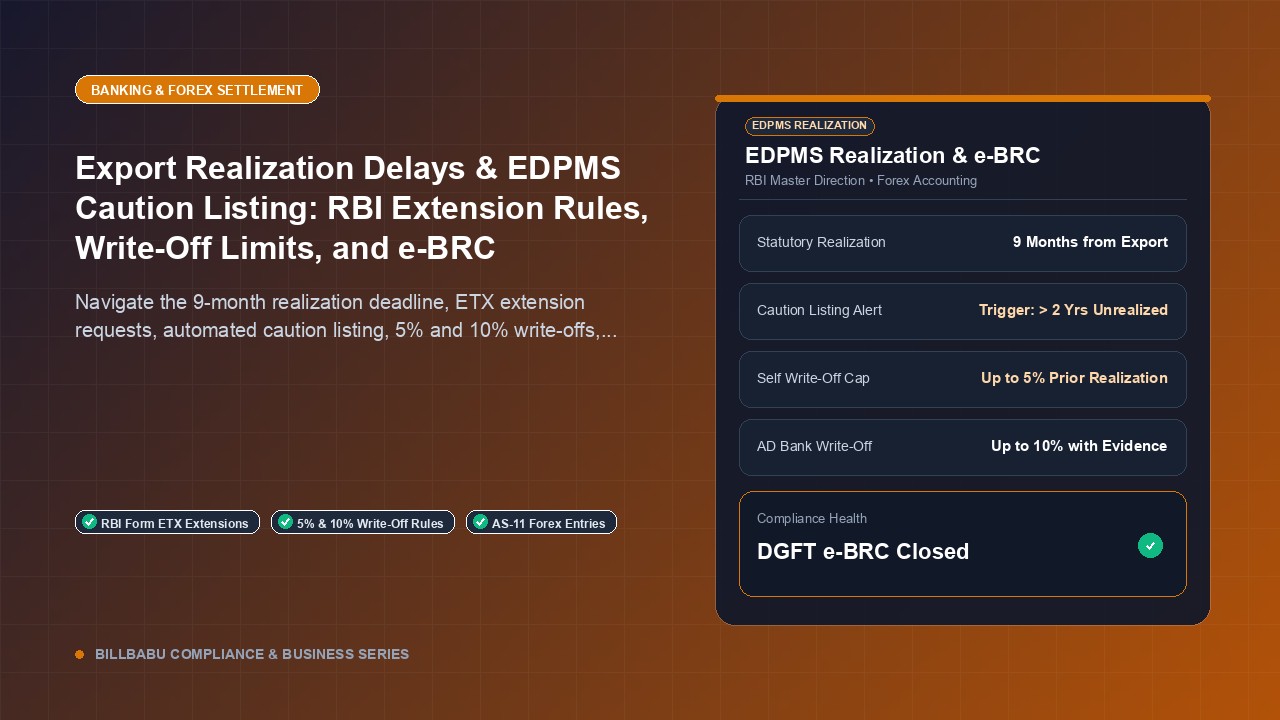
Export Realization Delays & EDPMS Caution Listing: RBI Extension Rules, Write-Off Limits, and e-BRC
8 min read
GST on Payment Gateway MDR & Daily UPI Settlements: Journal Entries, ITC, and Reconciliation Guide
7 min read
Fixed Assets Register: Format, Contents and Depreciation Schedule
3 min read
GST invoicing made easy for Indian small businesses
Create GST-compliant invoices & estimates, track payments, manage parties and inventory — all from your phone. 14-day free trial, no credit card needed.